Each piece of music has a key: the note on which the whole harmonic composition is built.
How can we use this information to visually represent the complexity of a musician's production over time?
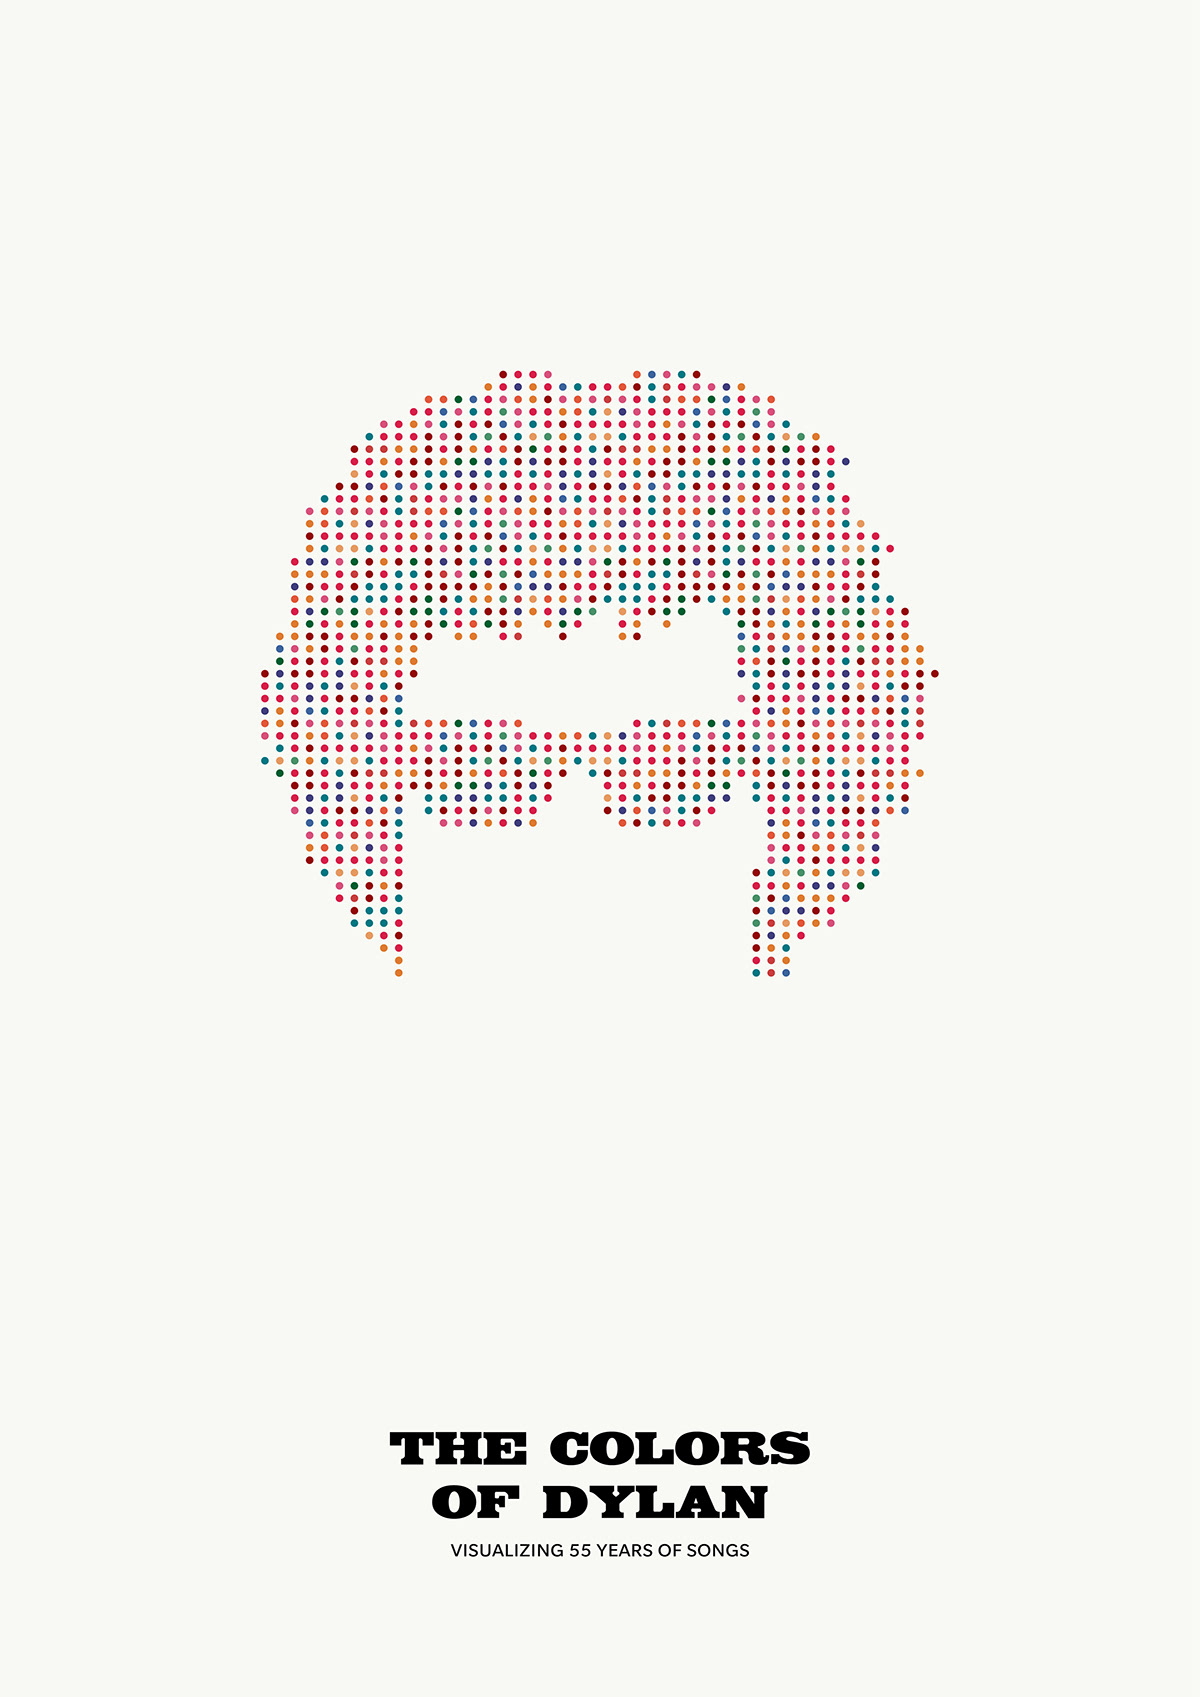
This data visualization project transforms each note into a color to tell the unique story of Bob Dylan's work through the 442 songs published in his studio record releases. The visualization is enhanced with other information telling us more about each song: its duration, its type (originals versus covers, blues, minor-key songs) as well as by the chance to rearrange them in different orders (chronological, record or key-based). The project was developed as a digital interactive application and as a series of printed posters.
Check the interactive interface in the video below, and feel free to visually explore 55 years of wonderful music.


